Rivers Lab: Human-Computer Interaction


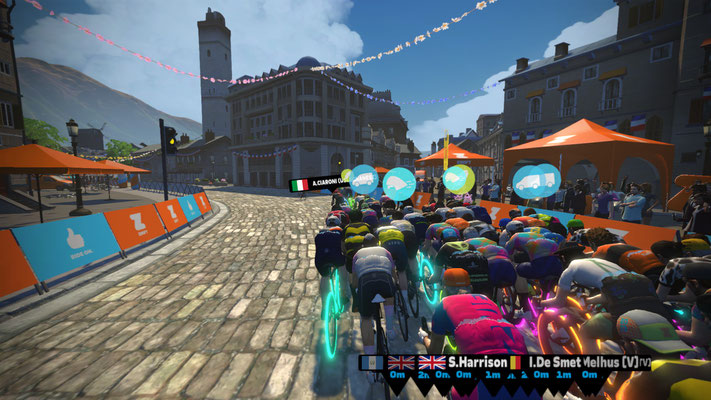
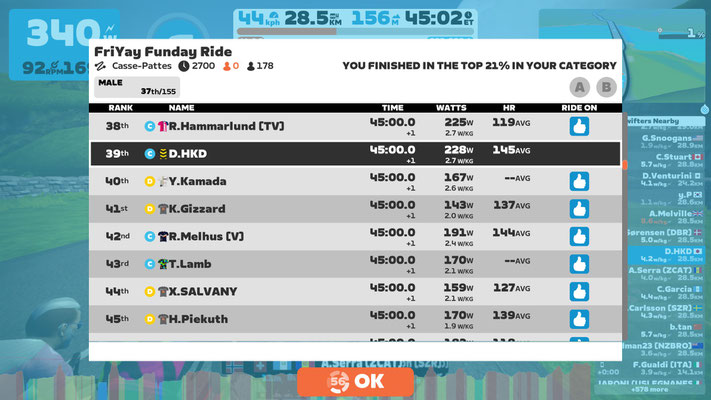
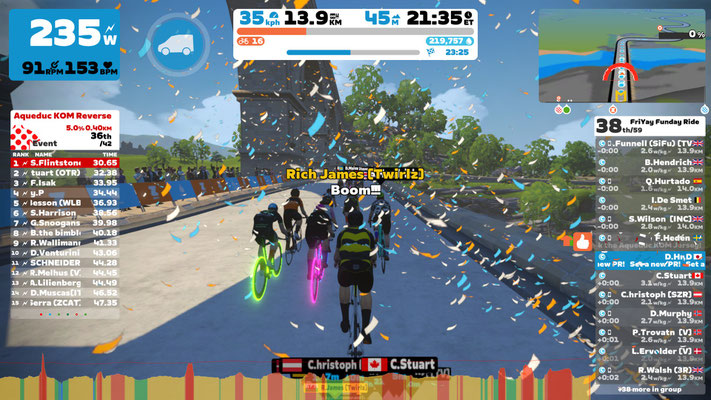
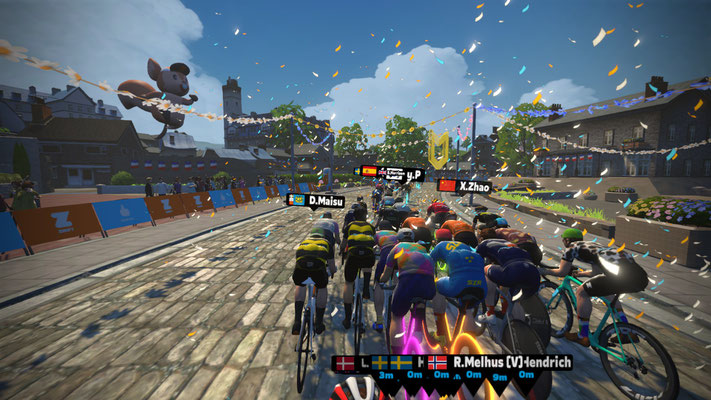
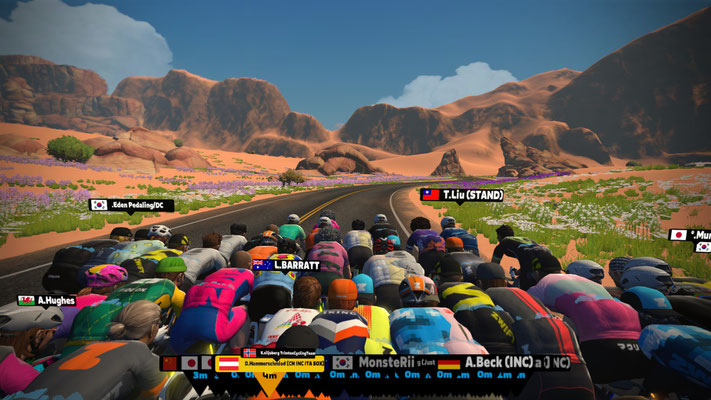
Modern virtual indoor training platforms like Zwift have significantly reshaped the cycling experience. With the growth of smart trainers and immersive virtual environments, indoor cycling has evolved into an efficient, data-driven, and socially engaging form of training. It provides consistent workouts unaffected by weather, traffic, or daylight, making it ideal for riders with limited time or specific performance goals. Research highlights benefits such as improved training efficiency, real-time performance tracking, and enhanced motivation through community features like group rides and virtual races. From an information systems perspective, Zwift offers a rich environment for studying user behavior, motivation, and performance. The platform incorporates game mechanics such as achievement badges, levels, in-game rewards, and social leaderboards to boost engagement and encourage consistent participation. These elements provide valuable data on how digital feedback, community interaction, and immersive design influence cycling habits and training outcomes. Zwift presents opportunities to study the intersection of technology, sport, and user experience—ranging from performance analytics to the psychological effects of virtual competition and collaboration.
Graduation Research Project 5
スマートバイク、UX 設計、パフォーマンスメトリクス
Smart Bike, UX Design, and Performance Metrics
- 本研究は、スマートバイクから得られる パフォーマンスデータ(出力ワット数・心拍数・ケイデンス)の 可視化インターフェースが、モチベーションや心理的ウェルビーイングに与える影響を検討します。 Human-Computer Interaction (HCI) の観点から、データ提示のデザイン (シンプル表示、詳細統計表示、ゲーミフィケーション要素など)がユーザー体験や態度的指標に与える効果を明らかにします。参加者は Zwift を利用し、異なる UI 条件で複数回のライドを行います。 パフォーマンスデータに加えて、ユーザー体験を測定する System Usability Scale (SUS)、 AttrakDiff(UX の魅力度・実用性・楽しさを評価)、 動機づけを測定する Intrinsic Motivation Inventory (IMI)、 心理的ウェルビーイング尺度を用います。 SEM を用いて「UI 設計 → UX 満足度 → モチベーション・継続意欲」の構造モデルを分析します。本研究は、UX および態度的評価を測定する調査を活用し、HCI 設計が 運動継続行動に与える効果を明らかにします。リアルタイムかつ直感的な UI は UX 満足度を高め、運動継続意欲にポジティブな影響を与えると予測されます。
- This study examines how UI visualization of performance metrics (power, heart rate, cadence) from smart bikes influences motivation and wellbeing. From an HCI perspective, it evaluates how different visualization designs (simple, detailed, gamified) affect user experience and attitudinal outcomes. Participants will complete Zwift rides under different UI conditions. Alongside performance metrics, surveys will include the SUS, AttrakDiff (UX attractiveness, pragmatic and hedonic quality), the IMI, and psychological wellbeing measures. SEM will test the model: UI design → UX satisfaction → motivation & adherence. This research integrates UX and attitudinal survey measures to clarify how HCI design promotes sustained exercise engagement. Real-time, intuitive UIs are hypothesized to improve UX ratings, which in turn will enhance motivation and exercise adherence.


Graduation Research Project 6
スマートバイク、スマートウォッチ、ストレスモニタリング
Smart Bike, Smartwatches, and Stress Monitoring
- 本研究は、スマートウォッチから得られる 心拍変動(HRV) や ストレス指標 を スマートバイク の運動負荷データと統合し、運動ストレスが 心理的疲労 に与える影響をモデル化します。 HCI と デジタルヘルス の視点から、ストレス検知と UX の関係性を明らかにします。被験者は Zwift で異なる強度のライドを行い、 HRV データ、ストレス指数、主観的疲労感(Visual Analog Scale: VAS)、 UX 質問紙(NASA-TLX、SAM[ストレス認知の仕方を評価])を収集します。 SEM を用いて「運動負荷 → HRV 低下 → UX ストレス評価 → 主観的疲労感」の因果関係を分析します。本研究は、ウェアラブルデータと UX 測定を統合し、 HCI 的アプローチによるストレス管理の可能性を示します。HRV の低下は UX 上のストレス評価と主観的疲労感を媒介すると予測されます。
- This study integrates smartwatch-derived HRV and stress indices with smart bike workload data to model how exercise stress influences perceived fatigue. It explores stress detection and UX within HCI and digital health frameworks. Participants will ride Zwift sessions at varying intensities. Data collected: HRV, smartwatch stress indices, subjective fatigue via VAS, and UX stress appraisals (NASA-TLX and SAM). SEM will model: workload → HRV decline → UX stress rating → perceived fatigue. This research integrates wearable data and UX surveys to demonstrate the potential of HCI-based stress monitoring. It is hypothesized that HRV decline mediates the relationship between workload and perceived fatigue via UX stress ratings.


Graduation Research Project 7
スマートバイク、グループライド体験、HCI と社会的ウェルビーイング
Smart Bike, Group Ride Experience, HCI and Social Wellbeing
- 本研究は、スマートバイクを用いた Zwift グループライドでの HCI 要素(順位表示、パワー比較、音声チャット)が、社会的臨場感や モチベーションに与える影響を検討します。 UX と 態度的評価を組み合わせ、社会的ウェルビーイングのモデルを構築します。参加者は ソロライドと グループライドを体験し、 パフォーマンスデータと UX 評価(SPS[他者の存在感を評価]、GPQ[グループ一体感を評価])、 態度的評価(IMI、SWLS)を収集します。 SEM を用いて「HCI 要素 → 社会的臨場感 → モチベーション/満足度 → パフォーマンス」のモデルを分析します。本研究は、UX・態度的評価を取り入れた SEM 分析により、 HCI 設計が 社会的ウェルビーイングと 運動パフォーマンスに与える効果を明らかにします。社会的フィードバックを強調した UI は、社会的臨場感と モチベーションを高め、運動パフォーマンスを向上させると予測されます。
- This study examines how HCI elements in Zwift group rides (ranking, power comparison, voice chat) influence social presence and motivation. UX and attitudinal surveys are used to model effects on social wellbeing. Participants will complete both solo and group rides. Data collected: performance, UX measures including the Social Presence Scale (SPS) and the Group Presence Questionnaire (GPQ), and attitudinal measures such as the Intrinsic Motivation Inventory (IMI) and the Satisfaction with Life Scale (SWLS). SEM will model: HCI features → social presence → motivation/satisfaction → performance. This research uses UX and attitudinal survey measures in SEM to clarify how HCI design impacts social wellbeing and exercise performance. HCI emphasizing social feedback is hypothesized to enhance social presence and motivation, improving performance.