Research, Education and Community Activities
The Center for Meta-Learning (aka CML) promotes, supports and informs the education environment at FUN, encouraging learning of students, staff and community by nurturing an awareness of personal transformative experiences. The Center for Meta-learning is a collection of integrated educational research projects and pragmatic activities at FUN coordinated by knowledgeable practitioners. To encourage our students in becoming more independent as learners, the Center for Meta-Learning is promoting the adoption of meta-learning: meta-learning is an autonomous process of objective thinking about one’s own performance, applying learning strategies to maximize opportunities to learn, and developing an awareness of one’s transformation. Meta-learning motivates people to consider: What I learn; How I learn; Why I learn. (https://www.fun.ac.jp/en/cml)
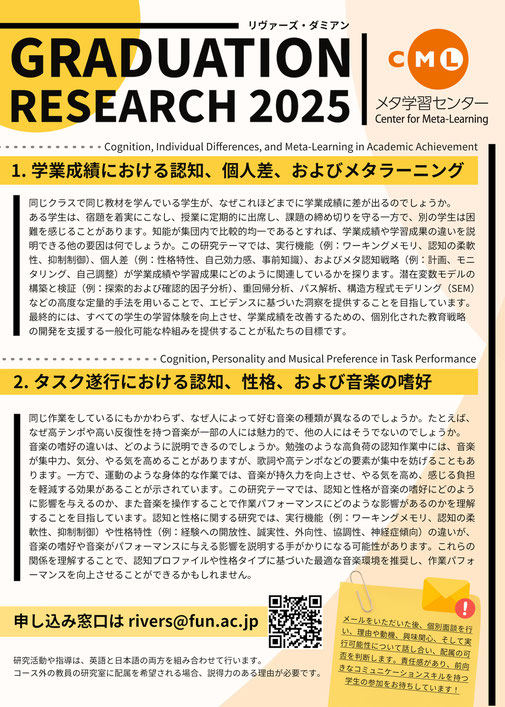
I can supervise graduation research in areas that explore how individual differences in cognition, personality, and metacognitive strategies influence performance across various contexts. One major area focuses on academic achievement—specifically how executive functioning (such as working memory, cognitive flexibility, and inhibitory control), personality traits, prior knowledge, and self-regulation relate to learning outcomes. Another area examines how personality and cognitive traits shape musical preferences and how different types of music impact performance in both cognitive and physical tasks. These topics are grounded in empirical research and supported by advanced quantitative methods including regression analysis, factor analysis, path analysis, and structural equation modeling (SEM). Students interested in evidence-based, interdisciplinary research—especially in educational psychology, cognitive science, or applied individual differences—are welcome to inquire. Supervision is offered in both English and Japanese, and individual interviews will help align research interests with project feasibility.

Zwift Virtual Community Cycling Research

From an information systems perspective, Zwift presents a rich environment for research into user behaviour, motivation, and performance. The platform incorporates game mechanics such as achievement badges, levels, in-game rewards, and social leaderboards to enhance user engagement and encourage consistent participation. These elements provide valuable data on how digital feedback, community interaction, and immersive design influence cycling habits and training outcomes. Zwift offers opportunities to study the intersection of technology, sport, and user experience—ranging from performance analytics to the psychological effects of virtual competition and collaboration.
Students in systems information science can use the Zwift platform as a dynamic environment for a wide range of research applications. With its rich integration of real-time data, user interaction, and gamified design, Zwift offers opportunities to study human-computer interaction, data analytics, behavioural motivation, and the effectiveness of AI-driven training systems. Research can also focus on areas such as social network analysis within virtual communities, the impact of gamification on user retention, and the design of adaptive feedback systems for personalized health interventions. The platform’s global scope and accessibility make it ideal for cross-cultural studies and longitudinal data collection.


Zwift also offers significant benefits for health and inclusivity by creating a global cycling community that transcends geographical boundaries. As a virtual platform, it enables people of all fitness levels, ages, and locations to participate in cycling in a safe, accessible, and socially connected environment. This inclusivity supports regular physical activity for individuals who may face barriers to outdoor exercise, such as limited mobility, harsh weather, or lack of safe cycling infrastructure. Zwift promotes cardiovascular fitness, endurance, and mental well-being through structured training plans and engaging ride experiences. At the same time, its social features—such as group rides, live events, and community challenges—foster a sense of belonging and motivation, helping users stay committed to their health goals. By removing physical and social barriers, Zwift helps democratize access to cycling and supports a more diverse and connected global cycling culture.


Hakodate Cycle Information Infrastructure Project

Cycling is more than just a sport—it’s a path to better health, a clearer mind, and a more sustainable world. As a low-impact activity, it improves cardiovascular fitness, strengthens muscles, and supports joint health, while also easing stress and enhancing mental well-being. In line with Japan’s national and regional efforts to promote cycling as a sustainable and healthy mode of transportation, Hakodate Cycle supports the goals set out by the United Nations’ 2030 Agenda and Hokkaido’s SDGs Promotion Vision. Government initiatives such as the Hokkaido Cycling Road and Friendly Road Hokkaido emphasize the value of cycling for community well-being, tourism, and environmental sustainability. We are proud to contribute to these goals by offering reliable, practical information and a platform for cyclists to share, explore, and connect.


Situation Specific Arousal Analyzer Project
Human emotion involves experiential, behavioural, and physiological components, yet research in the humanities has often focused mainly on self-reported experiences. With the rise of wearable technology, real-time physiological data is now more accessible. The Empatica E4 wristband and the Situation Specific Arousal Analyzer (SSAA) app—available for OS X and Windows—enable non-clinical research into autonomic nervous system arousal, with a focus on state-specific anxiety in foreign language education. SSAA represents a methodological innovation, allowing researchers to link physiological data with affective variables like motivation, achievement, and willingness to communicate, bringing new depth to language learning anxiety research.


Trait anxiety is a stable aspect of personality linked to a predisposition for heightened arousal, while state anxiety is a temporary response to specific environmental triggers. This situational nature allows researchers to control and observe autonomic nervous system arousal through experimental design. However, within foreign language education, capturing real-time fluctuations in state-specific anxiety has been limited by methodological constraints. Advances in wearable technology, such as the Empatica E4 wristband, now offer access to physiological data, though its raw format presents challenges for educational researchers. To bridge this gap, the Situation Specific Arousal Analyzer (SSAA) was developed to make E4 data usable in foreign language research contexts. The SSAA enables the analysis of physiological indicators like heart rate variability and electrodermal activity under customizable conditions, expanding methodological possibilities and moving research beyond self-report measures.


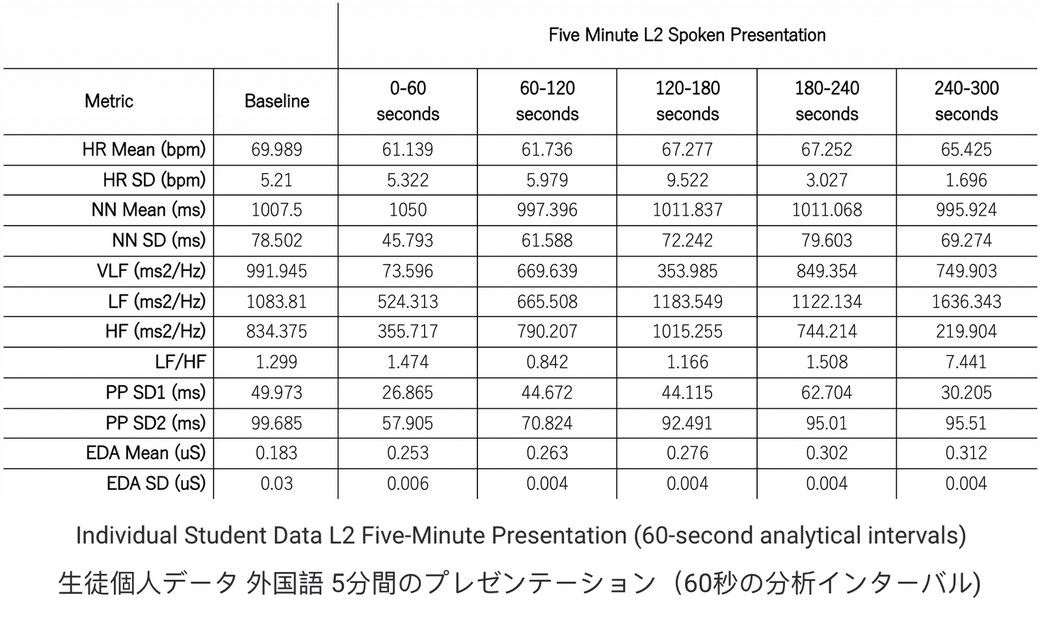
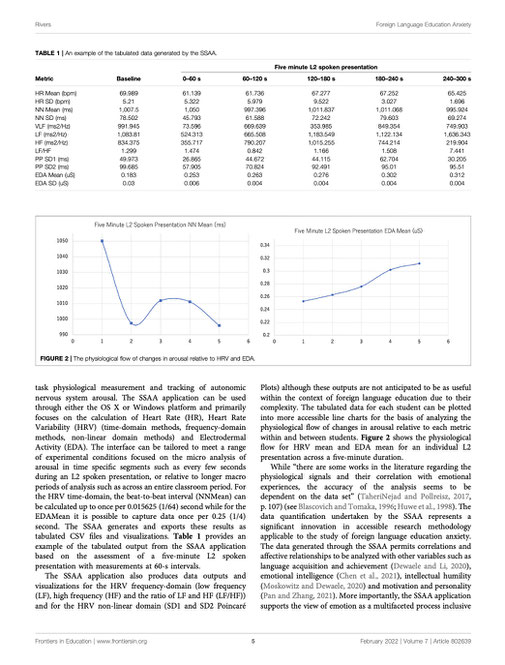
Using files exported from E4 Connect, the SSAA processes physiological data including Heart Rate (HR), Heart Rate Variability (HRV), and Electrodermal Activity (EDA) based on time intervals defined by the researcher. The interface supports both micro-level analysis—such as second-by-second changes during a spoken language task—and macro-level analysis across longer sessions like full classroom activities. For HR, the SSAA calculates mean (HRMean) and standard deviation (HRSD). HRV is analyzed across time-domain (e.g., NNMean, NNSD), frequency-domain (VLF, LF, HF, LF/HF ratio), and non-linear methods (SD1, SD2 via Poincaré Plots). EDA metrics include the mean (EDAMean) and standard deviation (EDASD), sampled as frequently as every 0.25 seconds. All results are exported as structured .csv files, along with visual outputs such as Lomb-Scargle Periodograms and Poincaré Plots, allowing for detailed, time-specific analysis of autonomic arousal.